An oscilloscope, as its name suggests, is an instrument that can display waveforms. As a common testing tool for electronic testing, it provides engineers with a series of functions such as system testing and problem evaluation. The development of oscilloscopes has gone through the era of analog oscilloscopes and digital oscilloscopes. Let us first understand the development and function of oscilloscopes and the tutorials and specific test methods for digital oscilloscopes.
At present, analog oscilloscopes have basically been eliminated, and nowadays it is the era of digital oscilloscopes. So what is a digital oscilloscope? Digital oscilloscope, also known as Digital Storage Oscilloscope (DSO), which is based on the real-time display characteristics of analog oscilloscopes. An analog oscilloscope relies on a cathode ray tube (CRT, commonly known as an electron gun) that emits an electron beam that deflects under the magnetic field formed by the signal under test, thereby reflecting the waveform of the signal under test on the screen. This process is instant, without any stored procedures in between.
The role of digital oscilloscope:
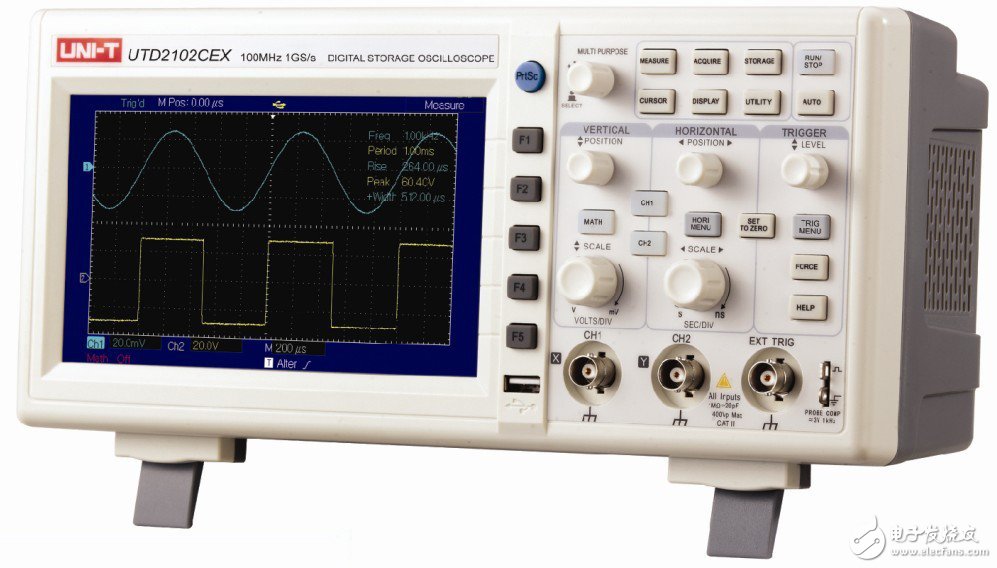
As a wide range of electronic measuring instruments, digital oscilloscopes are measurement instruments that are often used by electronics engineers. The role of the oscilloscope can be divided into the following categories:
1. Measure the waveform of the electrical signal (voltage versus time);
2. Measure parameters such as amplitude, period, frequency and phase;
3. With the sensor, measure all parameters that can be converted into voltage (such as current, resistance, temperature magnetic strength, etc.).
The principle of digital oscilloscope:
First, the oscilloscope uses the front-end ADC to quickly sample the measured signal. This sampling speed can usually reach several hundred M to several G times per second, which is quite fast. The back-end display component of the oscilloscope is the LCD screen. The refresh rate is generally only tens to more than 100 Hz; thus, the data sampled by the front end cannot be reflected to the screen in real time, so the storage is born: the oscilloscope temporarily stores the data sampled at the front end in the internal memory. In the middle, and when the refresh is displayed, the data is read in this memory, and the speed difference between the front-end sampling and the back-end display is solved by this level of storage.
How to use digital oscilloscope:
Similar to a multimeter, to use an oscilloscope, you must first connect it to the system under test, using an oscilloscope probe, as shown in Figure 20-4. Oscilloscopes usually have 2 or 4 channels (usually labeled with numbers from 1 to 4, and the extra probe socket is externally triggered, generally not used). Their low positions are equivalent and can be chosen at will. The probe is inserted into one of the channels, and the small clip on the other end of the probe is connected to the reference ground of the system under test. (There must be a problem here: the clip on the oscilloscope probe is directly connected to the ground, that is, the ground wire on the plug. If there is a voltage difference between the reference ground of the system under test and the ground, it will cause damage to the oscilloscope or the system under test. The probe touches the measured point, so that the oscilloscope can collect the voltage waveform at that point (ordinary The probe cannot be used to measure current, and the current probe must be selected for the current measurement.
Next, adjust the waveform on the oscilloscope panel to display the measured waveform on the screen in an appropriate size. You only need to adjust the parameters of the oscilloscope according to the two major elements of a signal—magnitude and period (the frequency is conceptually equivalent to the period), as shown in Figure 2.
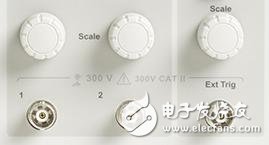
Figure 2 oscilloscope amplitude, time axis knob
As shown above, the knob above each channel socket adjusts the amplitude of the channel, that is, the adjustment of the vertical direction of the waveform. Turn them to change the voltage value represented by each vertical grid on the oscilloscope screen, so it can be called the "volt" adjustment, as shown in the following two comparison charts: 1V/grid on the left and 500mV on the right. /grid, the amplitude of the waveform on the left occupies 2.5 divisions, so it is 2.5V, and the amplitude of the waveform on the right shows 5 grids, which is also 2.5V. The recommendation is to adjust the waveform to the right, because the waveform occupies a large space in the entire measurement range, which can improve the accuracy of the waveform measurement, as shown in Figure 3.
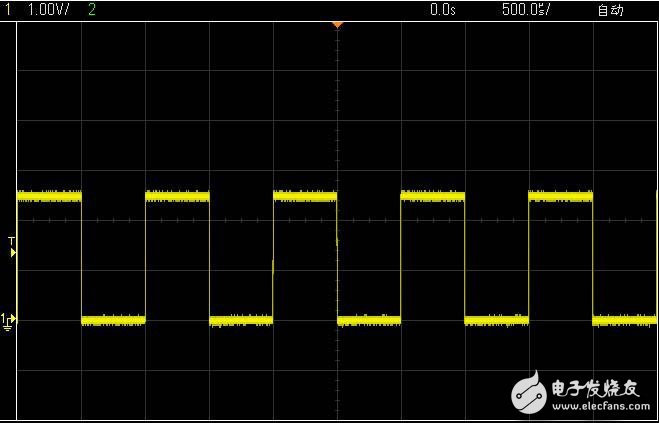
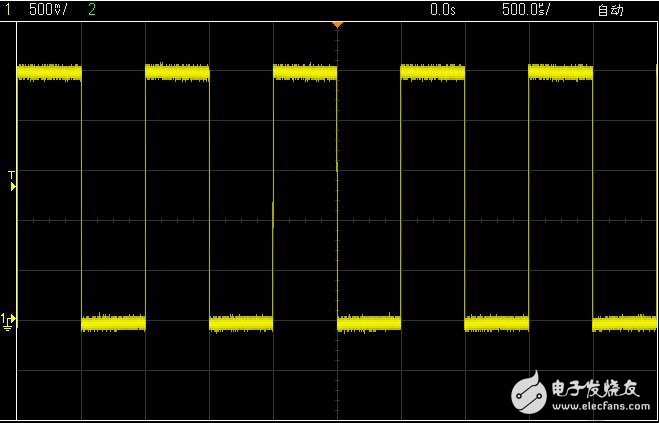
Figure 3 oscilloscope voltmeter adjustment comparison chart
In addition to the usual Volge knob above Figure 3, a similarly sized knob (not necessarily the position shown in Figure 20-6) is usually found on the panel. This knob is the adjustment period, that is, the horizontal direction of the waveform. Adjustment. Turn it to change the time value represented by each horizontal grid on the oscilloscope screen, so it can be called the “second grid†adjustment, as shown in the following two comparison diagrams: 500us/grid on the left and 200us on the right. /grid, the left picture takes 2 cells, the period is 1ms, that is, the frequency is 1KHz, and the right picture takes 5 cells, which is 1ms, that is, 1KHz. There is no more reasonable question here. The specific problems are treated in a concrete way, as they are very reasonable, as shown in Figure 4.
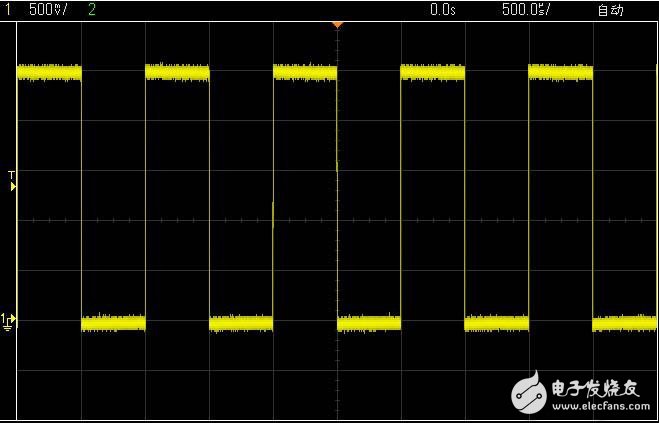
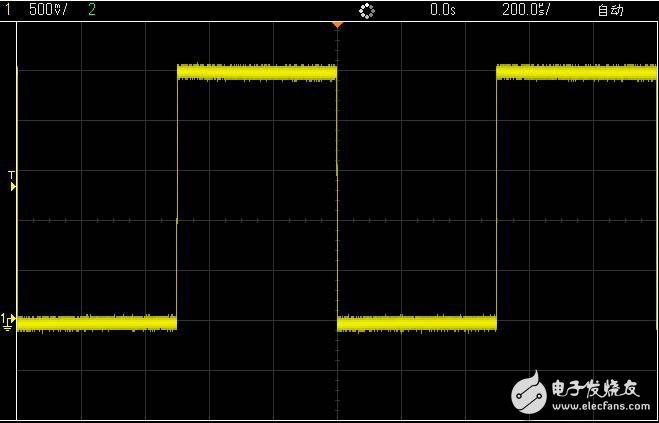
Figure 4 oscilloscope second grid adjustment comparison chart
In many cases, only the above two adjustments can be made, but a waveform can be seen, but the waveform is very unstable, and the left and right trembles and overlap each other, resulting in invisibility, as shown in Figure 5.
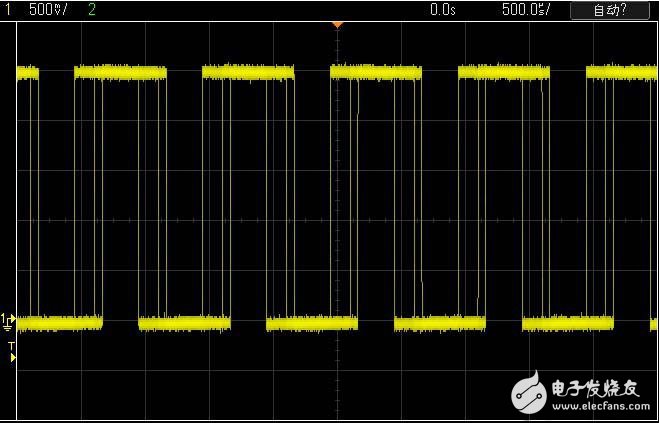
Figure 5 Schematic diagram of improper adjustment of the trigger level of the oscilloscope
This is because the oscilloscope's trigger is not adjusted well, then what is the trigger? Simply understand, the so-called trigger is to set a reference, so that the waveform acquisition and display are around this benchmark. The most commonly used trigger settings are level-based (also based on other quantities such as time, the same reason), let's look at the above waveforms, there is always a T and a small arrow on the left side, T is the meaning of the trigger The voltage value corresponding to the position pointed by this small arrow is the current trigger level. The oscilloscope always stores and displays the previous and subsequent parts as the waveform passes this level, so that the waveforms shown in Figures 4 and 5 can be seen. As shown in Figure 6, we can see that the waveform will not pass the position indicated by T anyway, that is, the trigger level will never be reached, so the waveform that has lost the reference looks unstable. How to adjust the position of this trigger level, find a knob labeled Trigger on the oscilloscope panel, as shown below, turn this knob to change the position of this T.

Figure 6 oscilloscope trigger knob
In addition to changing the value of the trigger level, you can also set the trigger mode: for example, select the rising edge or the falling edge trigger, that is, select the trigger level when the waveform is increased upwards or the trigger level or the downward direction. To complete the trigger, these settings are usually done through the buttons in the Trigger bar and the convenient menu buttons on the screen.
As long as the above three or four steps, you can apply the core functions of the oscilloscope, you can use it to observe the various signals of the microcontroller system. For example, if the system does not run after power-on, use it to test whether the waveform of the crystal pin is normal or not. It should be noted that the waveform on the crystal pin is not a square wave, but more like a sine wave, and the waveform on the two legs of the crystal is not the same. A small amplitude is used as an input, a frame. The larger value is output as shown in Figure 7.
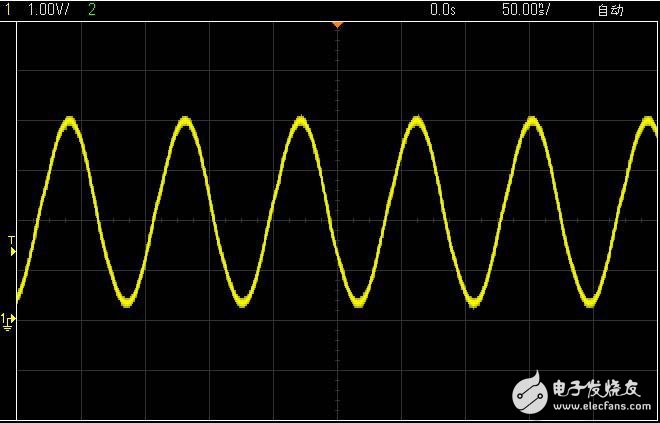
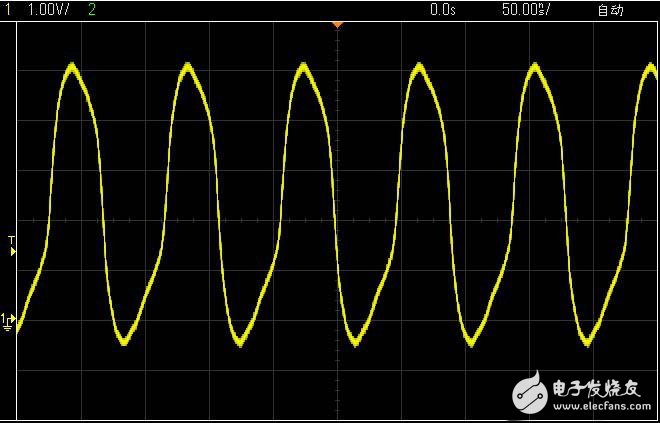
Figure 7 Oscillator measured crystal waveform
For more information on the oscilloscope, please refer to the oscilloscope label content: =>> Click to enter
Other oscilloscope data download:
Digital Oscilloscope Tutorial_Oscilloscope Usage
Introduction to use of digital oscilloscope
Electro Gold Pcb,Electronic Circuit Board,Gold-Plated Circuit Board,Gold-Plated Process Circuit Board
Shenzheng Weifu Circuit Technology Co.Ld , https://www.viafoem.com
